Breakout trading strategy
admin
- 0
A trading strategy involves following a plan of trades. Although it is possible to execute this strategy in several ways, one common way is through breakout trading.
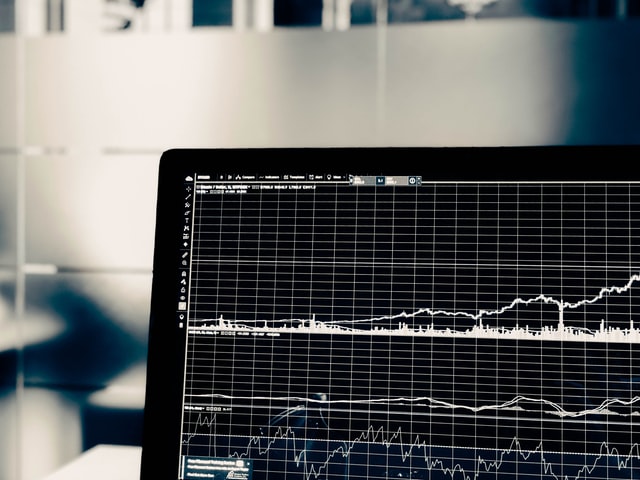
Breakout trading involves aggressive buying when the market price breaks above the upper range of its recent prices or selling short when it breaks below the lower range. These traders rely on the momentum created by these movements for their profits.
For example, suppose there was little buying activity in Apple stock since October 14th, 2013, at $450 per share. In that case, they might decide to buy aggressively once it broke the $460 per share threshold on November 11th because many people would be forced out of their long positions on momentum alone once this happened. Momentum would continue until supply overtakes demand or the price reaches a level where most traders feel the risk is no longer worth the potential reward.
How do traders enter into breakout trading?
The breakout trader enters into trades to anticipate a swift move in the underlying security. These traders prefer this approach because they can enter and exit the market quickly, locking in profits while minimizing losses if the trade moves against them. Because breakout trading is based on technical analysis, some guidelines can be used to help identify when security may be ready to break out.
Common indicators to watch?
Common indicators that breakout traders watch include moving averages, Bollinger Bands®, and chart patterns. Moving averages are computed by taking the average price of a security over a specific period. When a shorter-term moving average (such as the 15-minute moving average) crosses above a longer-term moving average (like the daily), this typically signifies that an uptrend is taking place. It could be used to initiate a long position or warrant aggressive buying once it breaks the $460 per share threshold on November 11th.
Bollinger Bands
Bollinger Bands® are plotted at standard deviations from a simple moving average. Based on historical data, a standard deviation identifies how much price movement is expected, and bands can be adjusted to identify more volatile periods of calm trading by widening or narrowing the bands.
Chart patterns
Chart patterns also provide clues about future price direction but should not be relied upon exclusively because other indicators failing does not mean chart patterns will fail.
No single indicator is perfect, and all traders should use a variety of indicators to make informed trading decisions. However, breakout traders typically focus on one or two indicators to increase their chances of success. It allows them to become proficient at reading these signals, which can then be used to time their breakout trades.
Risk of breakout trading
Although several traders use breakout trading as their primary strategy, it is not without its risks. The main risk is that the trade may not break out instead of returning to where the trade was initially entered. Additionally, traders must correctly identify when security is ready to break out and have an exit plan in place in case the trade does not move in their favour.
Breakout trading can be used on both stocks and commodities, and it can be employed using either technical or fundamental analysis. To successfully execute a breakout trade, it is essential to consider the direction of the breakout and its speed and volume. A breakout that occurs decisively is more likely to lead to sharp and sustained price moves than one that happens slowly or on light volume.
In conclusion
A breakout trade can be successful when markets rise or fall sharply, but it can also be profitable in a range bound market if traders enter the trade after it has gone on for an extended period. In such cases, all they will have done is correctly predict where support and resistance levels would lie during these periods of consolidation.
Although riskier than other trading styles, breakout trading is popular because it provides traders with the potential for significant returns. Because of this, it may be an appropriate strategy for traders who are willing to accept these additional risks.


